Process Improvement – Mapping
In order to improve any operational process and provide greater customer value, business processes first needs to be understood, and the easiest way to understand a process is by drawing or mapping it. Mapping forms the basis of all process improvement as it shows:
- The current state i.e. “this is how we presently do it”
- The link between information and material flow
- Mapping visually describes your facility…..a picture is worth a thousand words
- Highlights process steps and identifies areas of waste. Remember the general rule: “The more process steps, the more waste a process has”
- Supports team-based improvement
- Provides a model and common language for Continuous Improvement (CI).
Mapping can be done either at the macro or process level, where the former focusses on a high-level business or systems overview, typically between organisations and looks at the overall materials supply chain for procurement, manufacture and delivery. Macro mapping is suitable for large project management, e.g. NSW transport infrastructure and for planning and building a new housing development. Process level mapping on the other hand, is more common in business Lean applications where one typically analyses operational processes within a company, usually between departments. Examples include:
- Information flow for a repair or overhaul process
- Material flow for a specific product or process from raw material to finished goods
- Analysing quality issues or customer returns
- Analysing the paper trail from goods receiving to creditors and finally supplier payment
- Building a house
- Designing a new product.
Two simple types of maps that are commonly used are:
Process Flow Chart (see fig 1).
This is a great starting point to get an overall picture of the current process as it details the actual steps and decisions made during the execution of the process. Process charts are easy to do and allow the improvement team to quickly understand the process and identify areas of waste.
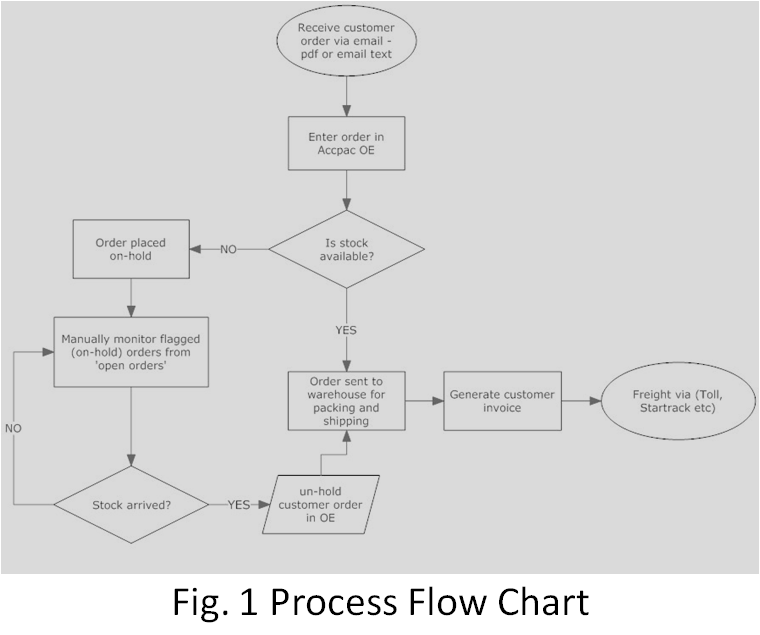
Diagram 1
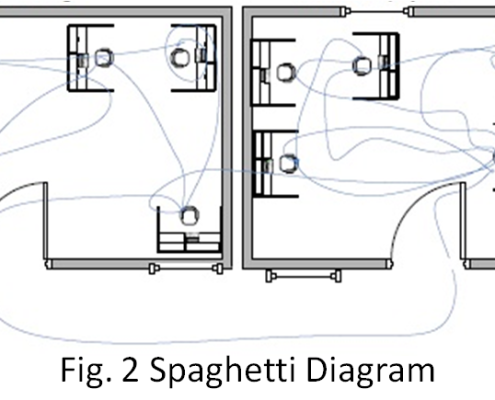
Spaghetti Diagram (see fig 2)
This is a scaled drawing of the facility showing the actual layout and tracks waste of transport and motion. This map allows one to determine the length of travel and is ideal for facility layout analysis and improvement. By showing the flow of materials or documents, it allows one to easily identify those steps that can be combined to eliminate waste.
Note: There are many other mapping tools available, but the these two are simple, effective and easy to use.
Once you’ve mapped your “current” state, it is essential to then map your “future” and “ideal” states, where the former is how you envisage the revised processes to be in the short to medium term. The “ideal” represents the ultimate long-term goal (perfection), which should serve as a guide or reminder for future improvement efforts. To give yourself the best chance of success, start with clear idea of what you want to achieve (future state), then improve existing processes before automating, and finally, make sure that the people at the coal-face are part of the process improvement team/s.


