Business Process Improvement

Danger Lurks In Your Inventory

Inventories are usually made up of many types of stock. There are fast-moving and slow-moving products. There are products with a high profit margin and products with low profit margins. Some products are in demand and other products past their peak. To simply look at an inventory as having a single ‘value’ can be very misleading.
At the bottom end of the inventory process is a warehouse full of dead items past their prime and can’t be sold for anything like their cost of acquisition. It’s truly amazing how much of this ‘dead’ stock is retained on the books at cost price and lingers in the warehouses of so many companies, adding to the value of their inventories but doing nothing for their sales.

An inventory is a dangerous thing. If it’s not properly managed it becomes the equivalent of money that’s depreciating at an increasing rate and can actually drop below zero value. Be aware of the danger and don’t let this situation develop.

How important is inventory as an asset? It’s probably the largest asset of most SMEs, but it’s by no means the most valuable asset in the business. The most important assets are those that turn the inventory into cash – the sales team, the marketing and the business’ customer relationships. That’s what keeps the business ticking over, not just a bloated inventory waiting to be sold.

Some businesses manage to trade quite profitably without an inventory of their own. ‘Just in time’ manufacturing processes created a whole new outlook on parts inventories that made maintaining huge stockpiles of components obsolete and saved manufacturers a lot of money. This line of thinking can be successfully applied to just about every inventory situation.

This taught businesses the importance of accurate sales forecasting – knowing what the demand for a product would be and when it would arise. Orders for components could be placed according to the projected demand and the need to retain year round inventories was eliminated.

Most proprietors at least know their sales volumes and would no doubt like to retain them. The catch is how can they do this and at the same time operate with a reduced inventory? If every item in the inventory turned over at the same rate this might be a problem, but a careful analysis of what’s in any inventory will find some fast movers as well as some items that have a much slower path to customers.

Go through the inventory in detail. Look at the age of what’s in stock as well as how quickly each item turns over and the search will soon find some real opportunities to cut down on the number of items there. It’s also possible to discover some items in the inventory that haven’t moved for so long they’re virtually obsolete. So it’s not just the total value of an inventory that’s important; it’s what it consists of bit-by-bit.

Now look at the profit margins the business earns on each item in the inventory. Relate this to the turnover rate for each item and some surprising facts will emerge. Finding items that turn over slowly and generate low profit margins should ring a huge alarm bell that perhaps these products can be either dropped from the range or sourced from suppliers ‘on demand’.

Inventory on its own doesn’t sell itself. Certainly a business wants to be able to provide its customers with fast-moving, high margin items with the least possible delay, and that’s where the focus should be. In most SMEs the ‘80/20’ law applies to the products they sell – 80% of the turnover comes from 20% of the products. It makes sense to have those 20% of products dominate your inventory and find alternative ways to handle the less-important 80%.

If an organization’s inventory is made up mostly of those ‘80%’ products it’s time to do some housecleaning. All they’re doing is depreciating from year to year and that capital could be better employed in selling more of the 20% products. Even if items in the old inventory will someday be moved, wouldn’t it be better to let someone else have the joy of buying and stocking them? Liquidate them and free up the capital for more productive uses. They can always be repurchased when and if required.

Always remember that an inventory represents cash just sitting there. It’s not cash in the bank; it’s cash that’s been invested and on which needs to generate a return. Everything in an organization’s inventory has a cost attached to it – just acquiring and warehousing it can be expensive, and the longer it’s unsold the higher the costs become.

Business Process Improvement

Greenhouse “sceptics” benefit from knowing their footprint

With the demise of the Emissions Trading Scheme, a lot of businesses are uncertain of what they should be doing/need to do with respect to carbon emissions. Senior Consultant Michael du Plessis and I have been working with one business which is not asking questions, but taking action. This leader in carbon neutral printing has been building their business in a sustainable manner for some years and surprising as it may seem, they see opportunities to reduce carbon as a way to improve their profitability.

One question we hear often in discussios with business managers and owners is – “If I don’t have to report on greenhouse gas (GHG) emissions, why would I be interested, specially in knowing my carbon footprint?” A very valid question, and one I have asked being a bit of a sceptic when it comes to global warming and the impact of carbon dioxide (CO2).

Well even if the sketics are right and GHG emissions were not causing global warming, if it becomes the catalyst for us to further cut down on waste and reduce pollution, it couldn’t be all bad. To quote Warren Buffett, “I believe the odds are good that global warming is serious…. If you have to make a mistake, err on the side of the planet. Build a margin of safety to take care of the only planet we have.”

While most businesses in Australia do not have to report on their GHG emissions, and more importantly, those that do only have to report on what is generated as a direct result of their manufacturing processes (this is known as Scope 1 & 2, not Scope 3 which refers to their supply chain), why would they be interested in knowing their carbon footprint?

We have discovered that many organisations that undertake a review of the environmental impact of their business operations come up with new ideas that can improve productivity and their bottom line. Often they are surprised that the environmental review comes up with ideas that they may not have considered before. For our client, we agreed to do a high level carbon footprint “snapshot”. What we discovered was that most of his carbon was generated by raw materials he bought in, not his actual manufacturing processes. He also discovered that the “carbon neutral” claims being made by his major competitor were at best, questionable.

From this high level snapshot we were able to determine that:

  • He could improve his bottom line and be more carbon friendly by changing his freight procedures.
  • He could covertly challenge the “carbon neutral” claim of his major competitor by changing his marketing, and at the same time position himself as an environmental leader.
  • By completing a detailed carbon footprint analysis he could provide a client who did have to report their emissions with information that made their task easier – a competitive advantage.
  • He was able to provide prospective clients with information relating to the carbon impact of various production options – those who wanted to make the environmentally responsible choice could do so.
  • He could see where the carbon is generated in the supply chain and then choose suppliers who were making efforts to reduce their carbon footprint, hence reducing his own. And with carbon having a cost associated with it in the future, better understand the cost implications on his business.

It’s true that not all organisations are under immediate pressure to measure their carbon footprint, however we are discovering that those looking at sustainability from an environmental perpective, are not just doing the right thing by our environment, but are also reaping commercial benefits of a more sustainable business.

To learn more about how being more “green” can benefit your business, give us a call.

Business Process Improvement

OEE – a measure of plant efficiency – what is it?

You may have heard of the term OEE – Overall Equipment Effectiveness.

This is a great way to measure the true utilisation of your capital equipment; you may be shocked at how low your utilisation actually is….

As well as taking into account the lost time due to planned stops (maintenance, meal breaks, shift changes) and breakdowns it also measures:

  • Product changeovers
  • Ramp down time and ramp up time
  • Time lost due to slow running
  • Rejects during start-up
  • Rejects due to quality issues

Why do we want this measure? It is a great way to see where your major losses are occurring and where you should be focusing your improvement actions.

Business Process Improvement

If we are serious about efficiency….it is an ETS

The continuous strive for excellence over the last 30 years has refined the methods and processes used resulting in LEAN principles and Six Sigma methods.

The systematic application of LEAN and Six Sigma has enabled many organisations to lead their industry in profitability and the most efficient use of raw materials and inputs.

Paul Kerin, Professional Fellow, Melbourne Business School, in his recent article states the case for the validity of an Emissions Trading Scheme(ETS) over a Carbon Tax.

For all of us who take an active role in improving the performance of businesses over the long term you should read the following article from the Australian.

Business Process Improvement

Practical Business Skills Training….TAG it!

It is common knowledge that in today’s complex business environment, good is frequently not good enough. TAG Team is a Business Skills Training System that stimulates Systems Thinking and encourages team members to ‘think outside the box’.

We all know that running a business requires that we have an input, a transformation process, and finally an output that we sell and deliver to our customers. If we do this efficiently, then the income generated from sales exceeds the operational expenses, and we make a profit.

But can it really be that simple?

Perhaps not…

Puzzle

TAG Team is designed to improve the understanding of business principles by simulating a typical business environment. The game is not a computer simulation, but rather a practical ‘hands-on’ game where groups or teams compete against each other in an attempt to generate the maximum profit for the team. The game highlights how common market and operational conditions impact on the profitability of any business.

TAG Team….

• Highlights the impact that market constraints, quality problems, lead times, operating efficiency, and process design have on business profitability.
• Is ideal for all levels and any mix of employees, from senior executives to operational staff members.
• Is fun, interactive and great for team building
• Is ideally suited to a total group size of 12 to 25 people.

Business Process Improvement

Want to make money through improvement in your operations…..quickly – here’s how.

What is MORE important – focus on the outcomes or the inputs to your business? I would argue that the output – e.g. profits or sales is a direct result of what you and your people are working on during the month, in other words the inputs.

The old computer saying – “garbage in garbage out” is true for how we run our businesses. So how do we know what we should be working on and how do we know it is directly related to my financial performance?

Step One: Identify the critical things you do in the business – or business processes.

For example a contract builder has about three critical processes to get right –tendering, sub-contractor selection, project management. These are all processes with inputs, step by step actions and if all are not well executed there is a high risk of losing REAL money.

So, first things first, look at your business and identify those top 5 critical “things” you and your team do each month. Write each one on a separate sheet of paper. On the left hand side write what you/your team do well; on the right hand side right what you could do better. Try and fill the sheet for each of your critical processes.

Step Two: What do I work on FIRST?

It is essential that you DO NOT try to fix everything at once, otherwise you will fail.

Review your five sheets of paper with your critical processes listed. Select those three that “if we get these right we will make a lot more money.”

Now with these three, review each sheet and highlight the most important What We Do Well and what We Could Do Better.

You now have six critical “things” to measure.

Why do we look at what we do well? Simply because this is why you are a success, why your customers buy from you and how you are positioned in your market. So KEEP DOING it and let all your people know this is critically important to the success of the business. Also, never take your eyes of these and do not let them slip while you make other improvements.

Step Three: Measure, Monitor & Remember?

For the six areas you have identified – set up a weekly measuring system for each one. One could be hours spent re-working mistakes. Get this down and you will make more money.

Report them each week, ideally on a big board so all the team can see. Have the actions that will be done over the next two weeks written out so everyone knows what is going to happen.

Do this for 3 months and see how you go. If the three that you do well have stayed flat or improved, FANTASTIC. Likewise if the three you could do better in have improved then FANTASTIC AGAIN. Your business results will be improving as a direct result of working on the INPUTS.

Remember – celebrate your success with the team and go back to Step One every three to six months. Within a short period of time your business will be on the path to Excellence.

Business Process Improvement

Process Improvement – the Essence of Lean

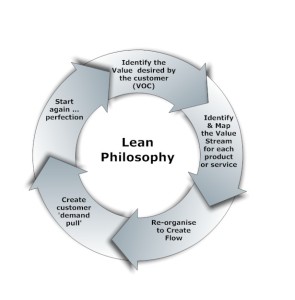
Lean is a philosophy to continuously identify and eliminate waste within an organisation, where waste is defined as any activity that does not, from the customer’s perspective, add value. Fundamentally the Lean Philosophy is about continuous process improvement to create a business system that optimally responds to customer demand.As is shown in figure 1 below, Lean can be depicted as a repetitive 5-stage process that begins with the identification of the value desired by the customers, where a ‘customer’ in this instance is not limited to the external customers that actually pay for a product or service, but includes any service recipient within the business itself.

Lean_process
Figure 1. Lean is a continuous 5-stage process

Having listened to the customer to understand the true value of the product or service from the customer’s point of view, one can then progress further down the Lean path and identify those internal processes that, again from the customer’s perspective, contribute, or add value to the product or service, i.e. identify the value stream for each product or service group. In order to improve any process, one must first gain a thorough understanding of its current state and the simplest way to achieve this is to draw or map the process to create ‘process map’. As shown in figure 2, this is the sequence of all current processes, both value adding and non-value adding from raw material to product launch or from initial customer contact to service completion.

Process_map
Figure 2. Basic Process Map

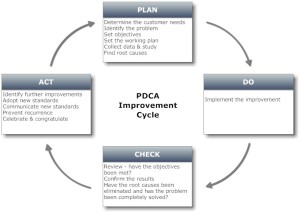
By adding information flows and other relevant data including lead times, batch sizes, processing times and number of operators to the process map, one can create a true Value Stream Map that can be analysed to identify problem areas, eliminate waste and plan for an improved future state. The classic Deming PDCA improvement cycle is often used as powerful tool in conjunction with process and value stream maps, to create flow (the third stage of Lean), and ensure that improvements are carried out in accordance with a well organised and defined methodology.

PDCA_cycle
Figure 3. Deming’s PDCA Improvement Cycle

In Deming’s cycle, the Plan is not just about planning, but also includes communicating and gaining consensus. Far too often companies neglect this phase and fail to properly identify constraints and/or ‘root causes’ of problems. It has often been stated that Japanese companies take much longer to plan, but then implement improvements faster and more smoothly than those companies that don’t. Do is the easy stage where the actual implementation is carried out, and this must be followed by the all important Check phase. The Check is actually a learning phase where the prevailing question should be “is the change sustainable and did it work as we predicted, and if not, what can we learn for next time?” The final phase is the Act, where the emphasis is to standardise and communicate the improvement, prevent recurrence and to prepare for the next round of the cycle. The PDCA sounds simple but it is often glossed over as many organisations concentrate on the ‘do’ and neglect the P-C-A, or alternatively adopt Murphy’s corollary to Deming’s PDCA cycle, i.e. “Please Don’t Change Anything”.In addition to process and value stream maps, various other analysis tools can be used in the PDCA cycle, for example, spaghetti diagrams, fish-bone diagrams, root cause analysis, activity sampling and risk analysis. Further, the PDCA cycle may be varied to encompass the 6 Sigma methodology known as DMAIC (Define, Measure, Analyse, Improve, Control), but the fundamental aspect of the improvement cycle remains unchanged.Process improvement is the essence of Lean, for without improvement, any organisation will fail. For a sustainable business, process improvement must reach all levels and involve all value streams within the business, both internally and along its supply chain.For further information contact:

Mike Karle

Mobile: 0410 780-627
mike.karle@informgroup.com.au